
How Do You Turn a Soil Test into a Blend Sheet?
A soil test report lists numbers; a blend sheet turns them into bags. The translation has four steps - yield target, nutrient removal, soil supply credit, and raw material arithmetic - and every step has a standard way to go wrong. This article walks one worked example from report to blend sheet, ending at the numbers a blending plant can actually run.
In this article
- The Four-Step Translation
- From Ratio to Recipe: a Worked Example
- The Honest Limits
- Buying and Handling Basics
- Frequently Asked Questions
- Conclusion
The Four-Step Translation
Step one: the yield target converts to nutrient removal - crop tables list how many kilograms of N, P2O5 and K2O each ton of harvested yield carries away. Step two: the soil test grades supply as low, medium or high, and each grade credits the field with a share of the need - a high index can erase most of a phosphorus bill. Step three: organic credits - manure, compost, stubble - subtract further. Step four: the remainder is expressed as product per hectare, and then converted into the blend's percentage analysis. Skip a step and the blend sheet inherits the error silently.
From Ratio to Recipe: a Worked Example
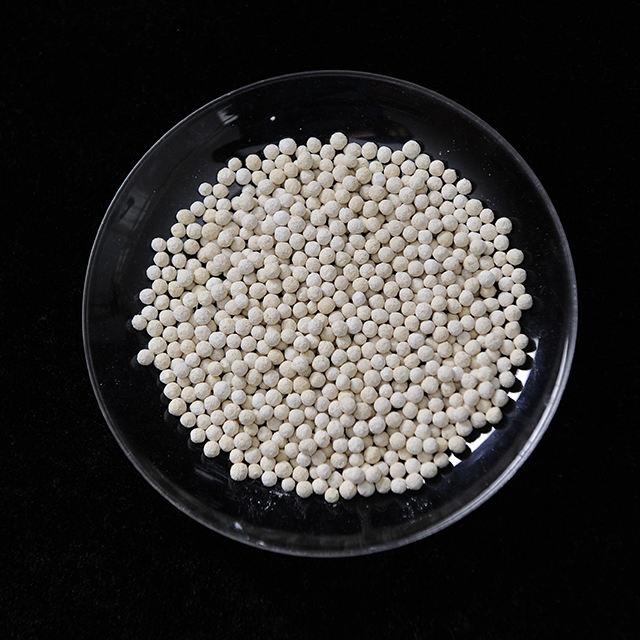
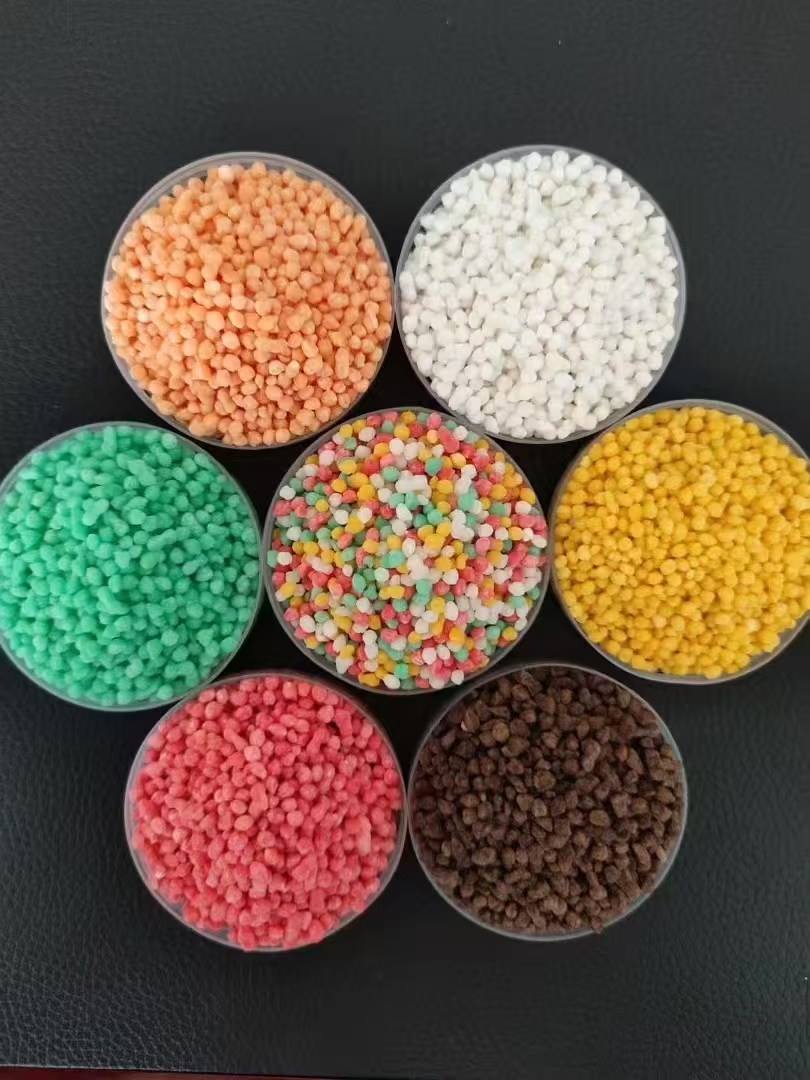
Suppose the arithmetic lands at a need of 150 kg N, 75 kg P2O5 and 75 kg K2O per hectare, with the plan to apply the base blend at 625 kg per hectare and topdress the rest of the nitrogen later. Dividing through, the blend must analyze 24-12-12. Now solve 100 kg of blend: phosphorus first - 12 kg P2O5 comes from 26 kg of DAP (which brings 4.7 kg N); potassium - 12 kg K2O comes from 20 kg of MOP; remaining nitrogen 19.3 kg comes from 42 kg of urea; that totals 88 kg, so 12 kg of filler - ground dolomite on acid ground, zeolite where holding capacity helps - closes the sheet. The blend plant receives four percentages, not a philosophy.
|
Step |
Item |
Value |
|
Need after credits |
N - P2O5 - K2O |
150-75-75 kg/ha |
|
Base blend rate |
Applied at planting |
625 kg/ha |
|
Blend analysis |
Target specification |
24-12-12 |
|
Urea 46-0-0 |
Share |
42% |
|
DAP 18-46-0 |
Share |
26% |
|
MOP 0-0-60 |
Share |
20% |
|
Filler (dolomite / zeolite) |
Share |
12% |
The Honest Limits
A blend sheet is a per-field document: one sheet averaged across a whole farm quietly redistributes money from needy fields to fat ones. Micronutrients enter by exception only - documented by soil test, delivered as counted carrier granules, the zinc-coated and granulated-boron route from earlier volumes. Removal tables are averages; variety, yield level and residue handling move them. And the blending plant has its own gravity - SGN-matched stock, moisture limits and filler availability may force a rounding or a share adjustment, so the sheet conversation happens with the plant before the order, not after the delivery.
Buying and Handling Basics
- Contract the sheet: the analysis, SGN and uniformity per material, a moisture ceiling, and bag weight tolerance.
- Split the nitrogen: the base blend carries 30-50% of total N; topdressing supplies the rest where uptake happens.
- Re-test and re-sheet every two to three seasons, or after a jump in yield records.
- Packing: 25/50 kg woven bags or 500/1000 kg jumbo bags; private-label printing available.
Frequently Asked Questions
Q1: Why not put all the nitrogen in the base blend?
Because base-applied nitrogen leaches, volatilizes and pushes early lodging long before the uptake peak arrives. The base carries 30-50% and topdressing delivers the rest at the stages that actually consume it.
Q2: What goes into the filler?
Something inert that helps: ground dolomite on acid ground, zeolite where holding capacity is welcome. The filler also keeps the target analysis inside what the raw materials can actually deliver.
Q3: How do micronutrients fit into a blend sheet?
By exception and as carrier granules - coated zinc or granulated boron counted into the recipe after a soil test documents the need. Powder micros segregate out of the blend.
Q4: How often should the sheet be rewritten?
Every two to three seasons, or whenever yields jump a step. Yield records are the second half of the soil test - without them the next sheet guesses.
Conclusion
A blend sheet is a translation exercise: report numbers become removal, removal becomes product, product becomes granules. Done in order, it ends at a sheet the blending plant can run tomorrow - and every subsequent bag of the same recipe carries one doubt fewer.
If you are looking for a reliable fertilizer supplier that offers consistent quality and professional support, Tianjin Rongda Fertilizer Co., Ltd. is ready to help. Contact us today to learn how our fertilizer solutions can improve your agricultural productivity.
Related News
- How Do Controlled-Release Curves Match Crop Demand?
- Can Magnesium Sulfate Be Used in Saline-Alkali Soil? What Are the Risks of Long-Term Application?
- How Does Applying Magnesium Sulfate After Grape Harvest Help Bud Burst in the Next Year?
- Which Magnesium Sulfate Fits Your Ground?
- Can Foliar Spraying Magnesium Sulfate During Fruit Expansion Improve Fruit Sweetness?
- How Do You Judge a Blended Fertilizer Before You Buy It?
Leave me a message